EcoPark Economic Impact Estimate
Transforming the current 100-acre zoo campus into the San Francisco EcoPark would not only create a world-class public destination — it would become a net economic generator through tourism, education, green jobs, and avoided infrastructure costs.
Estimated total annual economic impact: $90–216 million
Projected ROI period: 4–6 years after opening full Phase 2
The EcoPark doesn’t just pay for itself — it pays the city back, financially, environmentally, and socially.
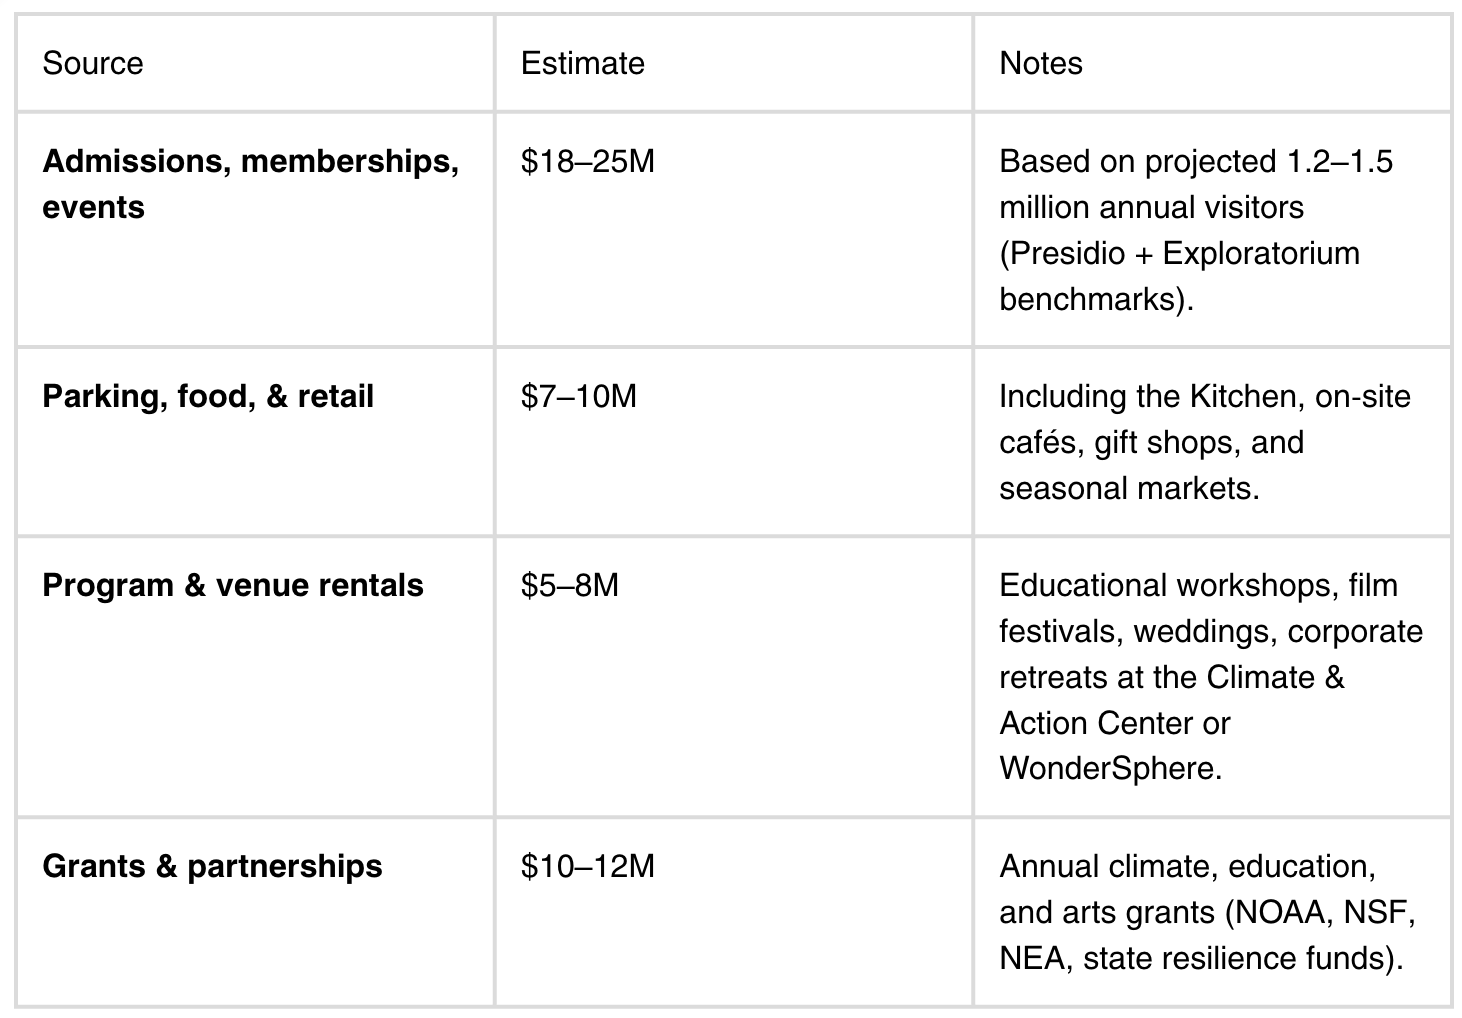
1. Direct Revenue to the City: $40–55 Million / Year
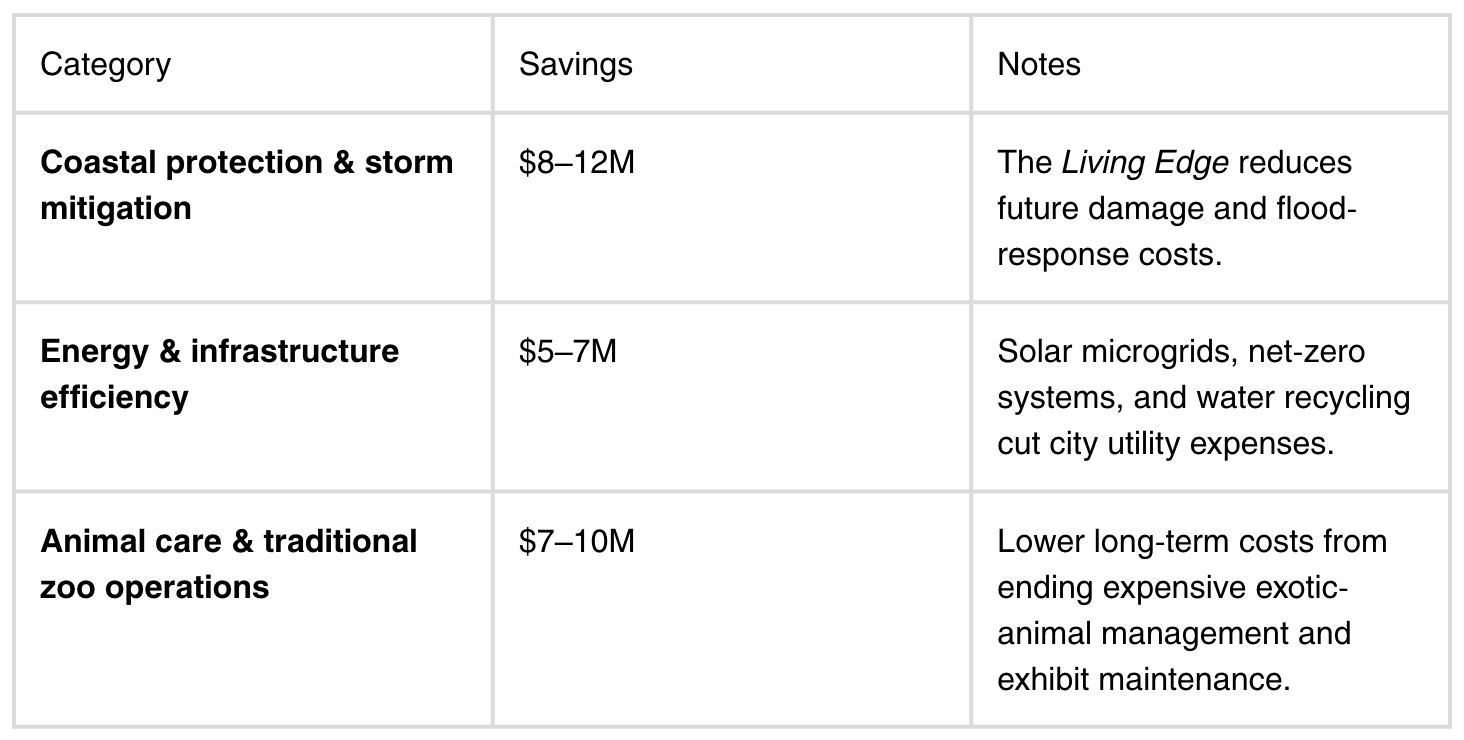
3. Avoided Costs & Long-Term Savings: $20–25 Million / Year
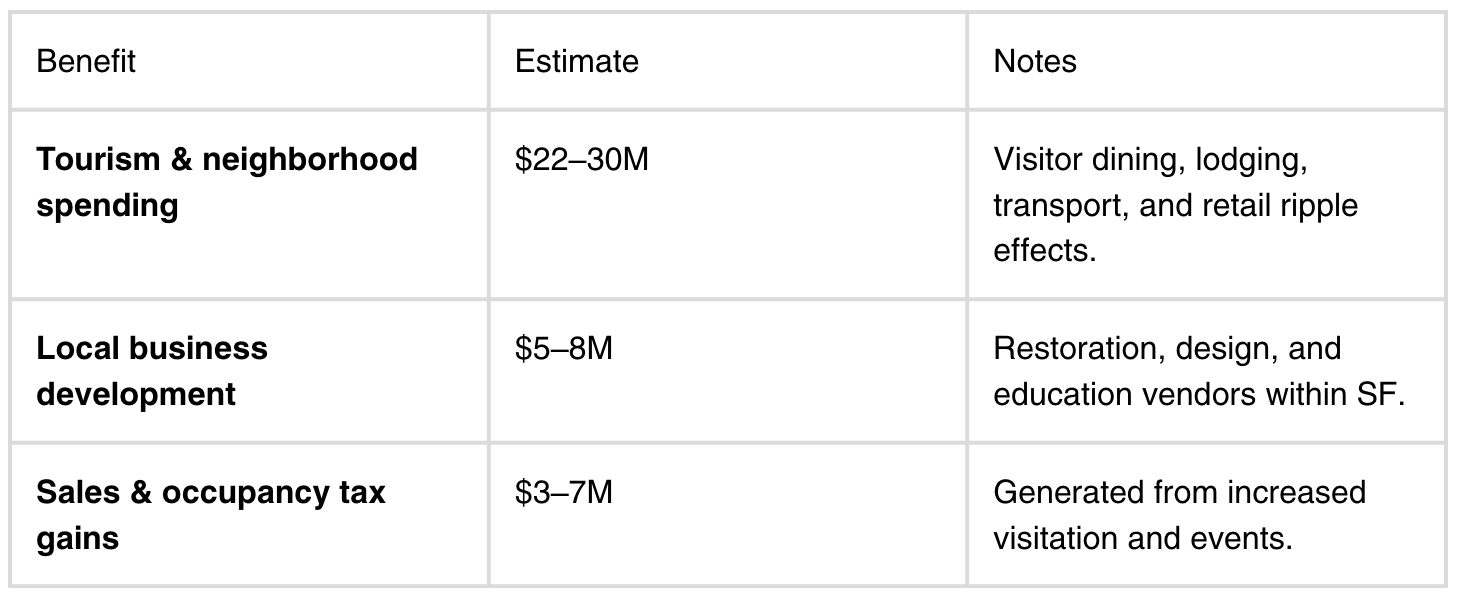
2. Indirect & Induced Revenue: $30–45 Million / Year
4. Employment & Job Creation
Construction phase: 1,800–2,200 jobs (union trades, restoration, fabrication, design)
Permanent operations: ~450 jobs (educators, scientists, artists, maintenance, hospitality)
Youth internships / workforce pipeline: 150–200 annual placements via the Climate & Action Center
These jobs feed directly into San Francisco’s green economy goals, generating roughly $25–30 million in local wages each year.
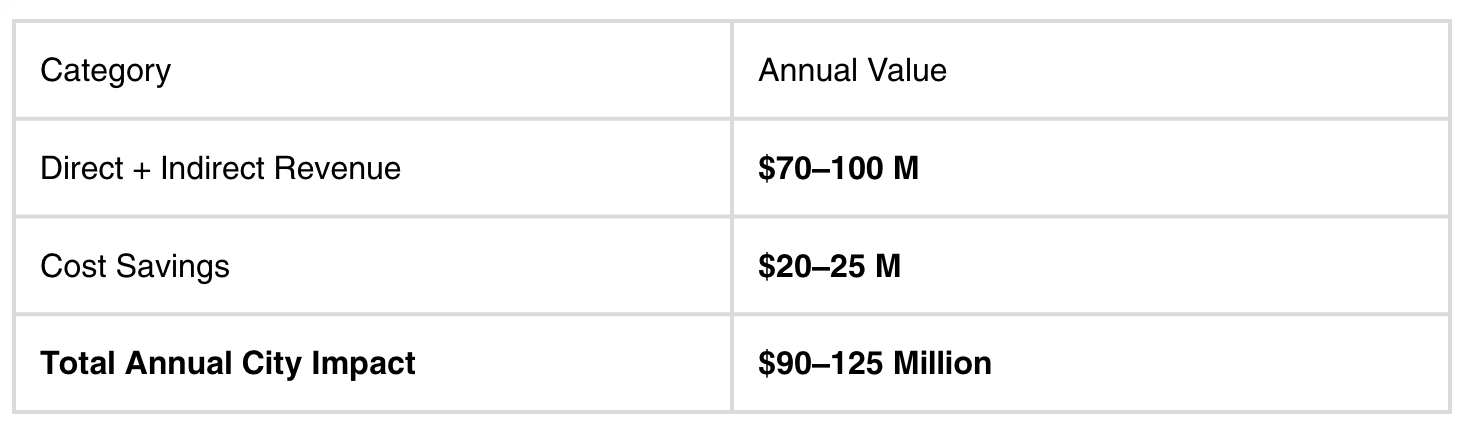
Total Estimated Annual Impact
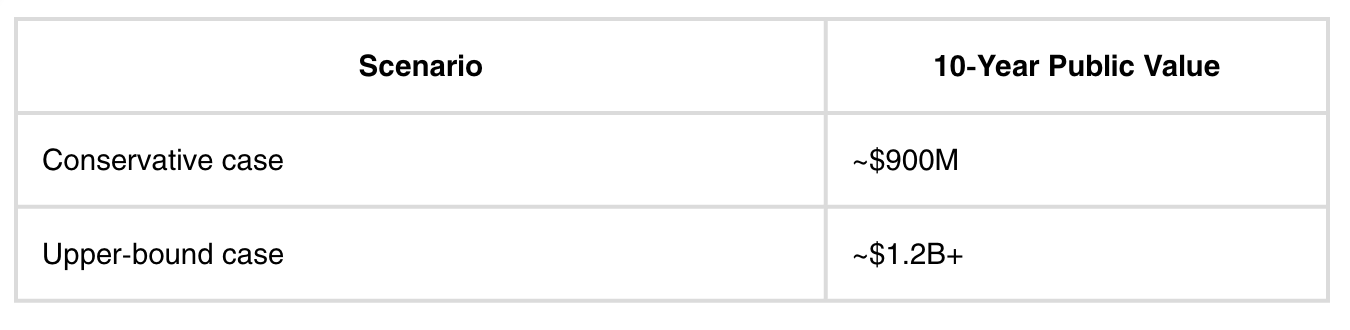
At conservative growth rates (2–3% annually), the EcoPark could generate $900 million to $1.2 billion in combined economic benefit and cost avoidance over its first decade — far exceeding its initial capital investment.
10-Year Outlook
Public Value & Financial Sustainability
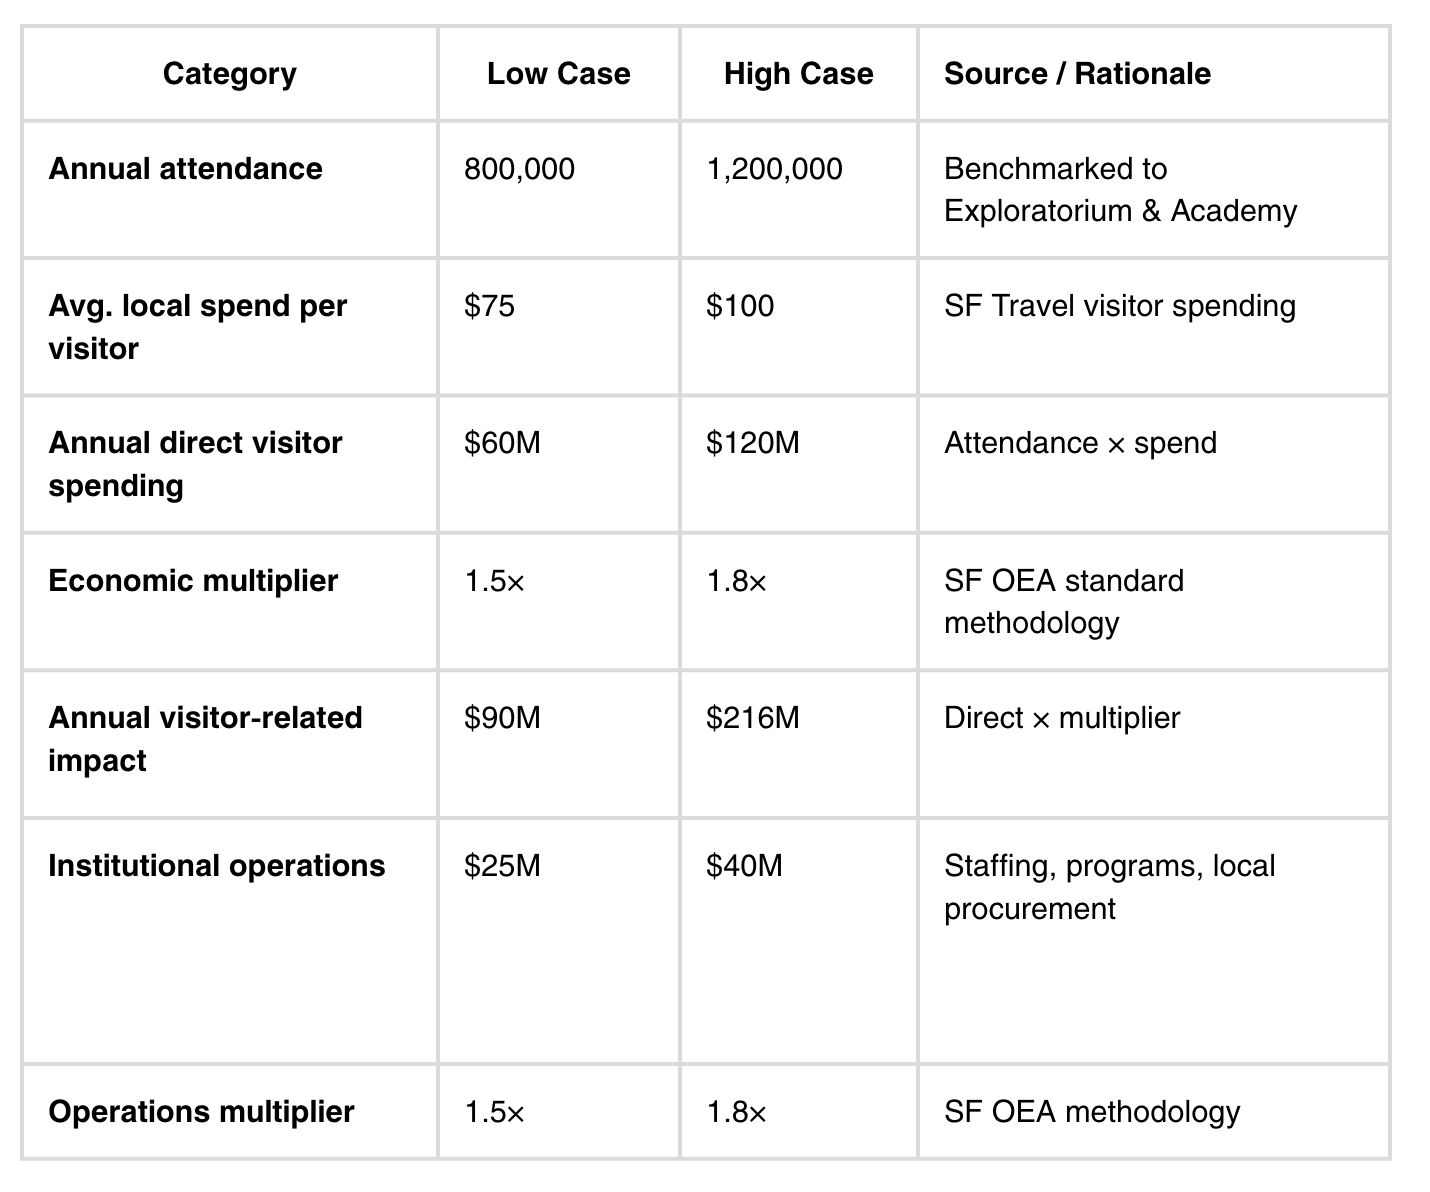
EcoPark SF is estimated to generate $900 million to $1.2 billion in public value within a decade based on a projection model that uses (a) San Francisco visitor volume and spending baselines published by San Francisco Travel Association¹², (b) attendance benchmarks from major comparable institutions that already draw large, repeat visitation—most notably the California Academy of Sciences³ and the Exploratorium⁴—and (c) the City’s standard approach to evaluating citywide ripple effects (direct, indirect, and induced impacts), as reflected in economic impact work produced through the San Francisco Controller’s Office / Office of Economic Analysis (OEA)⁵⁶.
Inputs & Assumptions
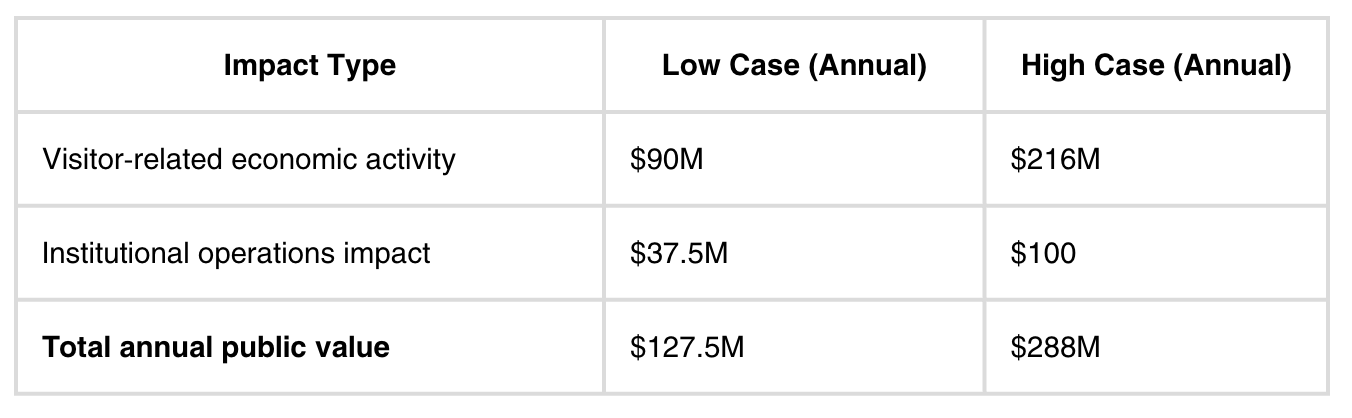
Annual —10-Year Public Value
10-Year Cumulative Public Value
Methodology note: These public value estimates assume a phased ramp-up period followed by stabilized operations and are intentionally conservative. The projections exclude construction-phase economic impacts, hotel stays associated with EcoPark visits, inflation over the 10-year period, major one-time events or festivals, and grant dollars flowing into the San Francisco economy. By limiting the model to ongoing visitor activity and core institutional operations, the estimates are designed to reflect a baseline level of public value rather than an optimistic or all-inclusive scenario.
Meanwhile, the current zoo’s audited financials show a structurally constrained picture: the Zoo reported a $6.36 million loss from operations in FY2024, and net assets declined by approximately $5.51 million in FY2025 (June 30, 2025 vs. June 30, 2024), according to San Francisco Zoo & Gardens audited financial statements⁷⁸. These audited trends underpin the conclusion that EcoPark SF offers a more financially sustainable alternative—not because attendance is guaranteed, but because the EcoPark model is designed to operate like a modern civic institution, with diversified earned revenue and eligibility for climate, education, and restoration funding that traditional zoo models generally cannot access.
References
San Francisco Travel — San Francisco Statistics (visitor volume, direct spending, economic impact)
https://www.sftravel.com/media/info/san-francisco-statisticsSan Francisco Travel — 2025 Tourism Forecast & 2024 Results
https://www.sftravel.com/media/press-release/san-francisco-travel-announces-2025-tourism-forecast-2024-resultsCalifornia Academy of Sciences — Impact (states “over 1.5 million guests a year”)
https://www.calacademy.org/impactExploratorium — Impact Report FY24
https://www.exploratorium.edu/impact-report-24City & County of San Francisco — Office of Economic Analysis (OEA)
https://www.sf.gov/information--office-economic-analysisOffice of Economic Analysis — Sample Economic Impact Report
https://media.api.sf.gov/documents/250700_economic_impact_final.pdfSan Francisco Zoo — FY2025 Audited Financial Statements
https://www.sfzoo.org/wp-content/uploads/2025/12/SFZS-2025-Final-Audit-Report.pdfSan Francisco Zoo — Financials (Audits & Budgets Index)
https://www.sfzoo.org/financials/
EcoPark vs. SF Zoo: A Smarter Future for the Same Site
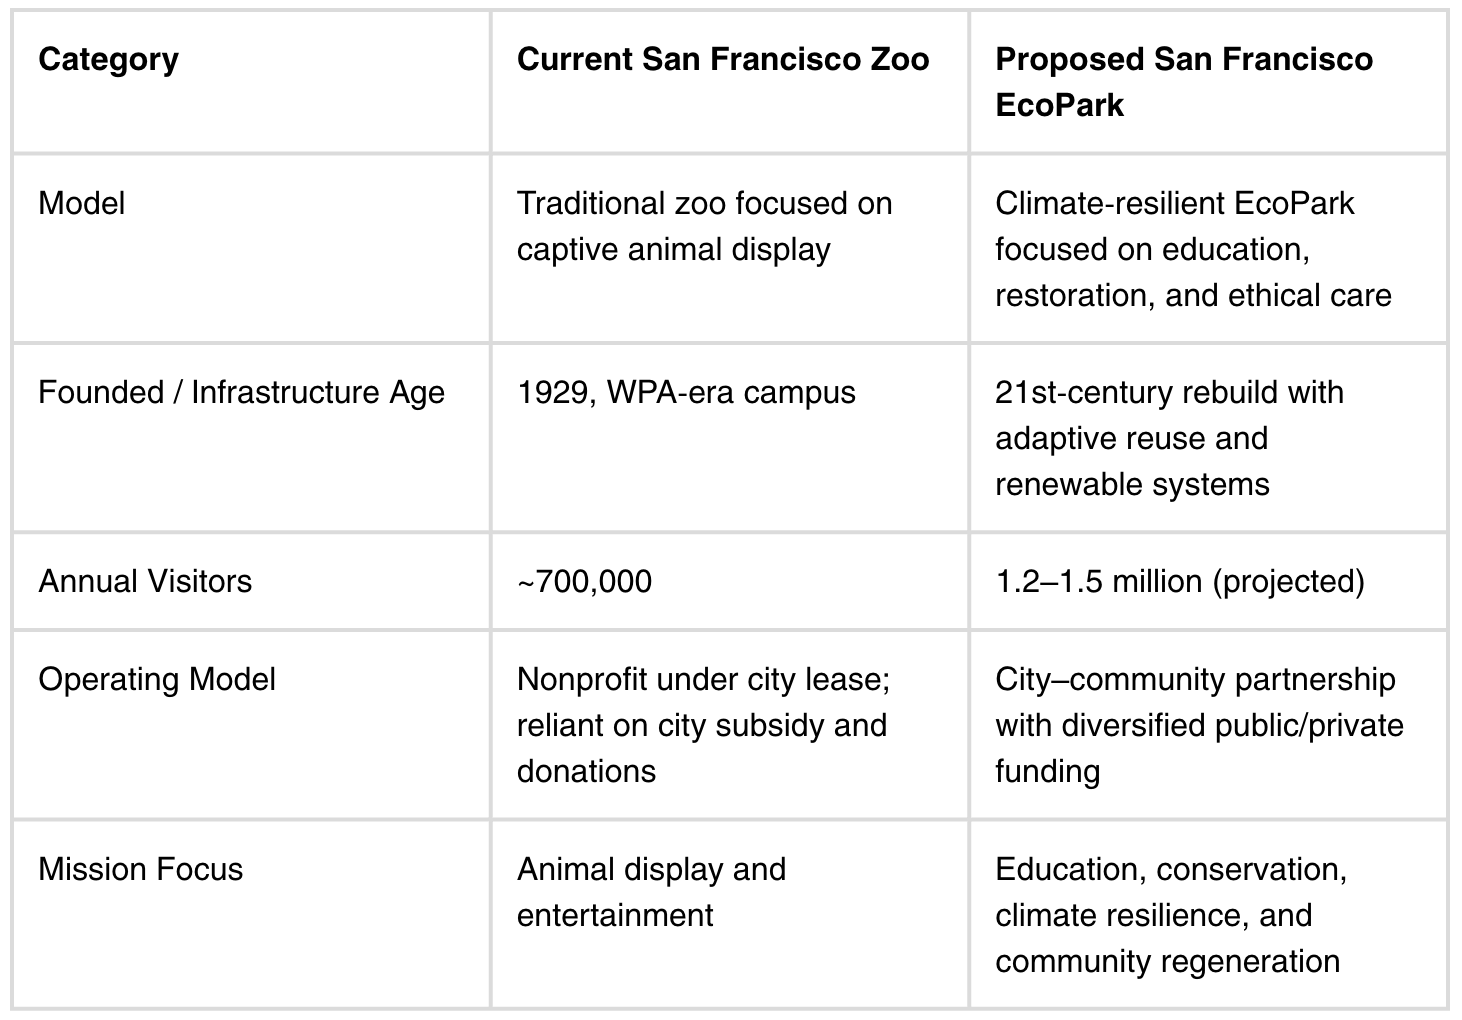
Overview
Economic & Civic Impact
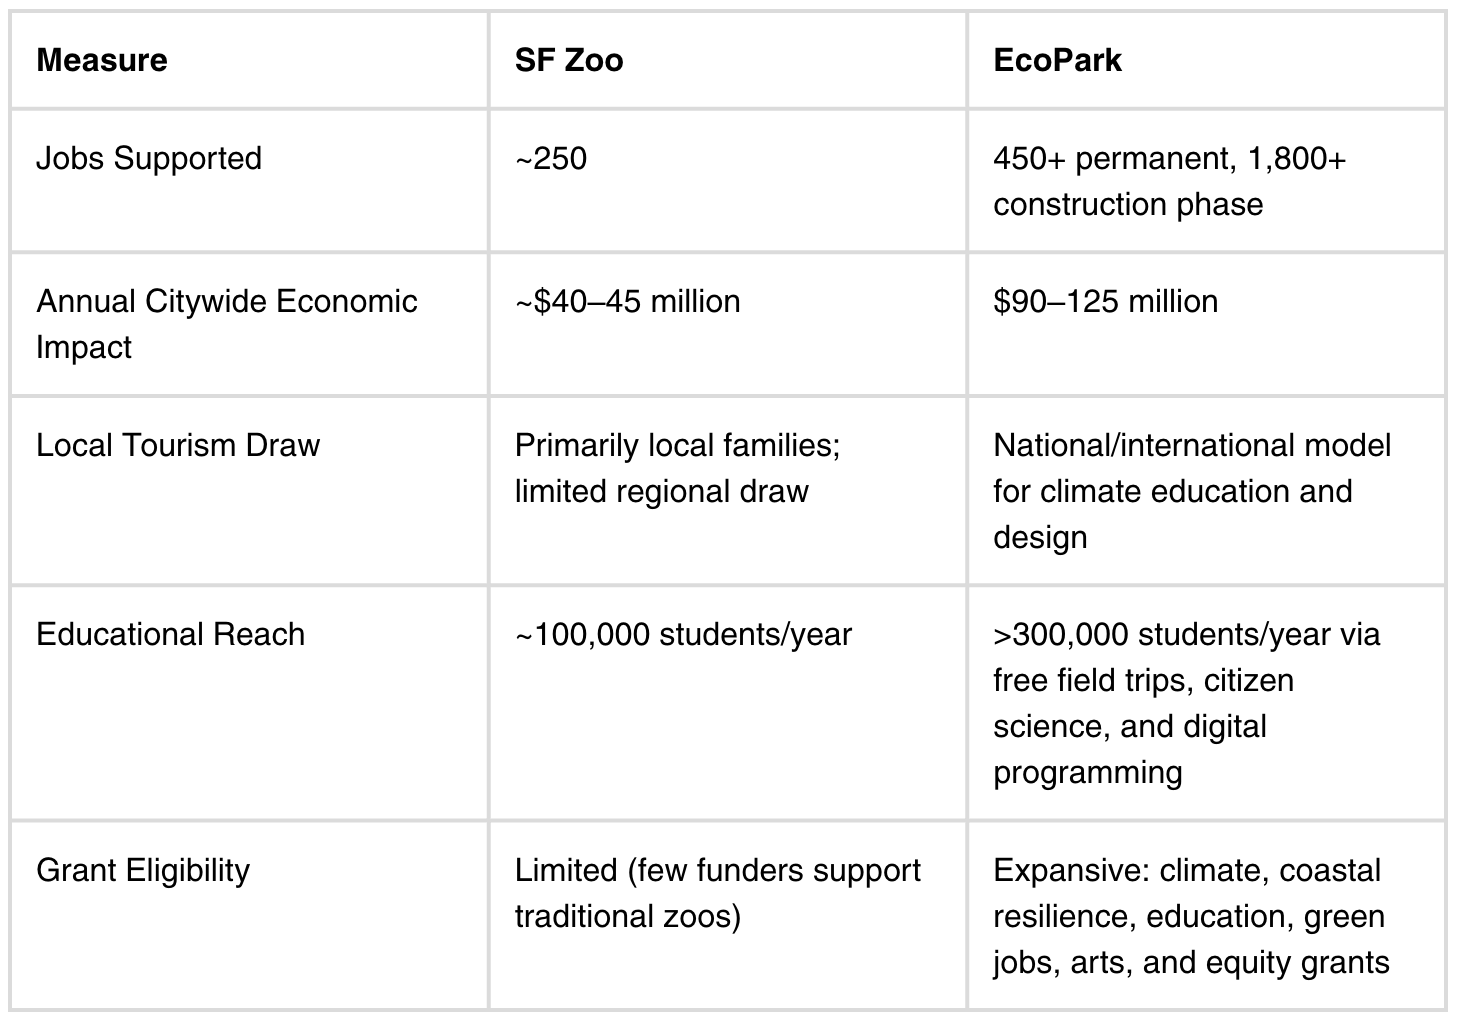
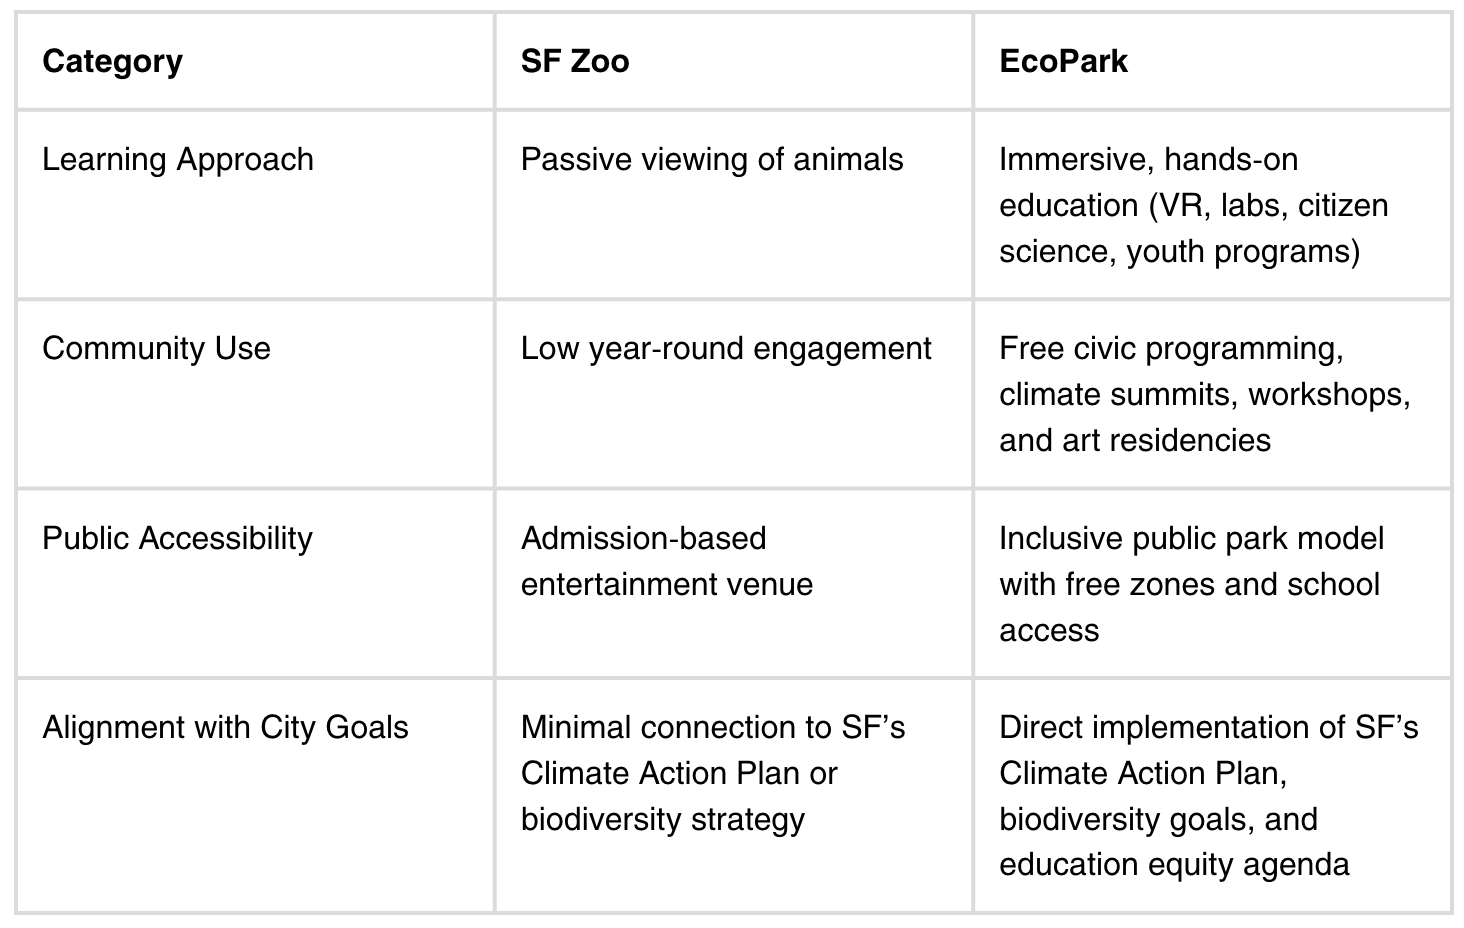
Social & Educational Value
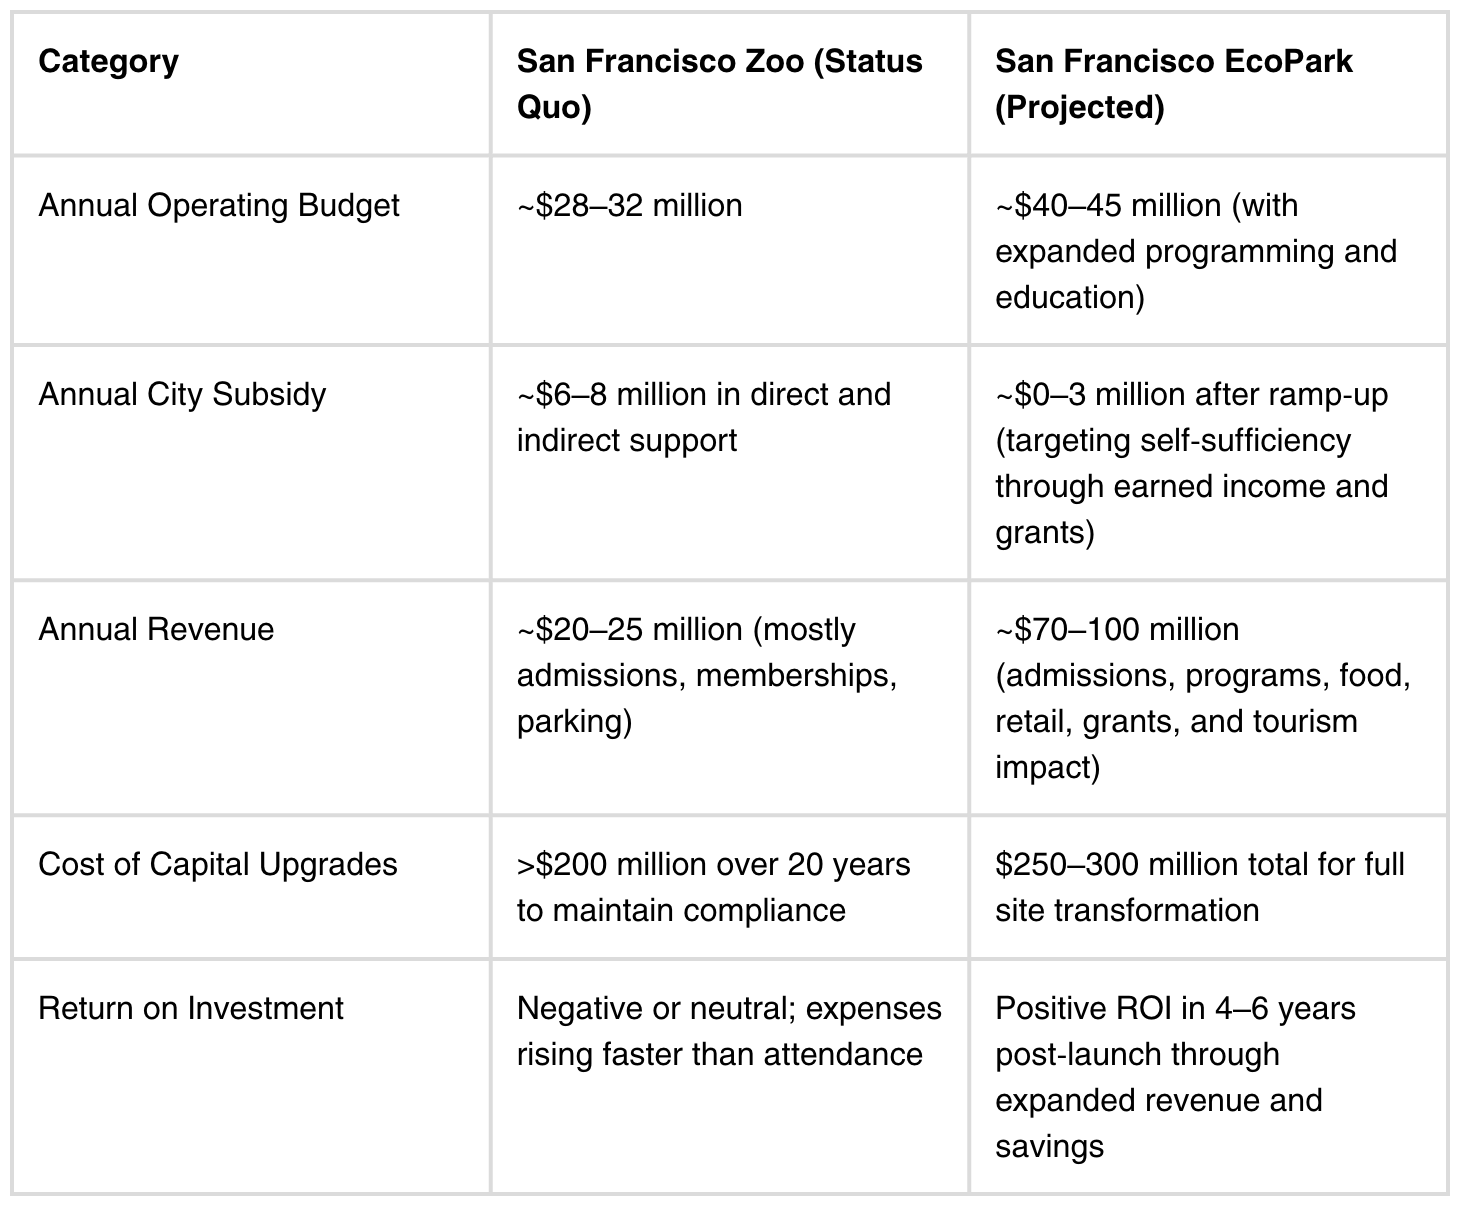
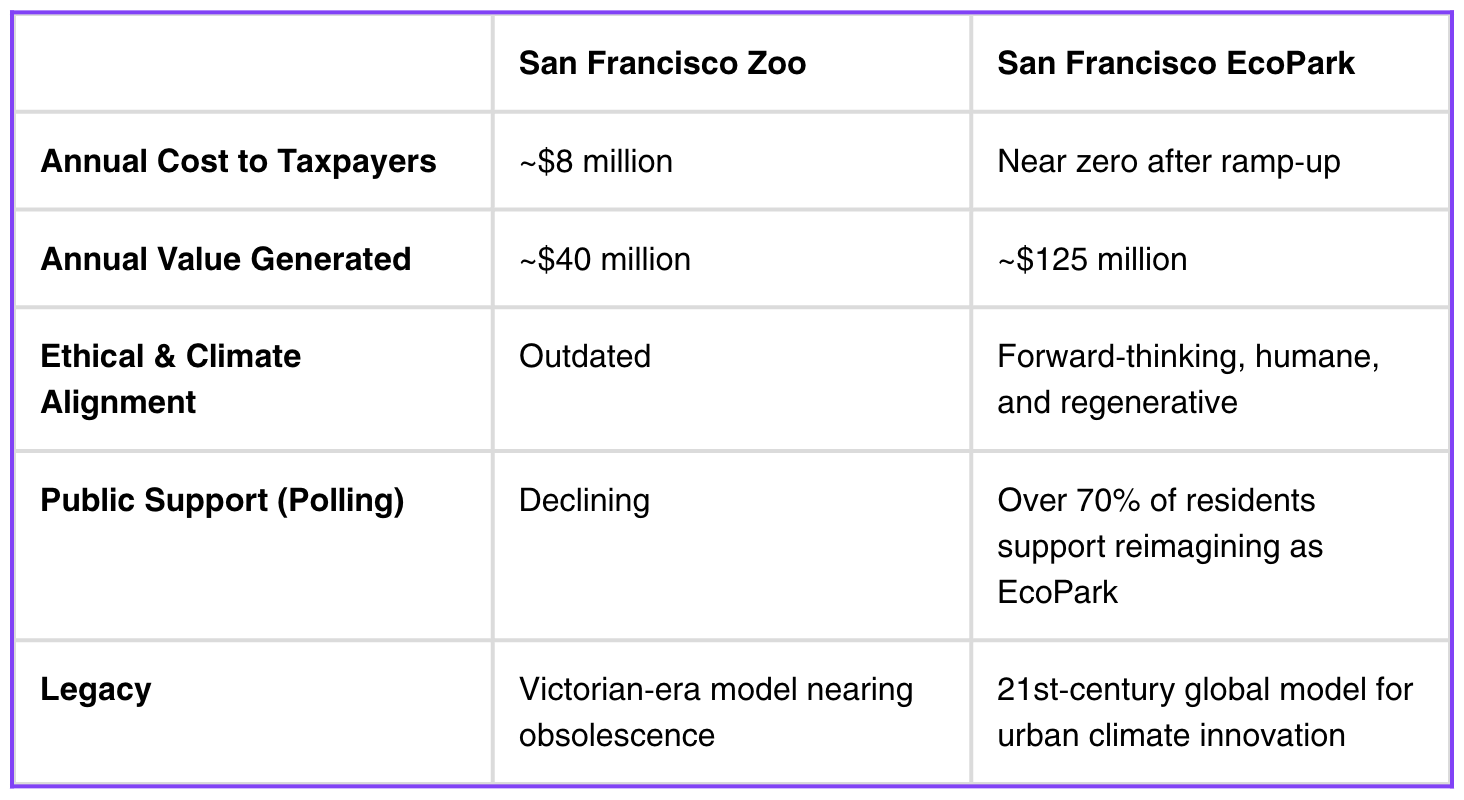
Financial Comparison
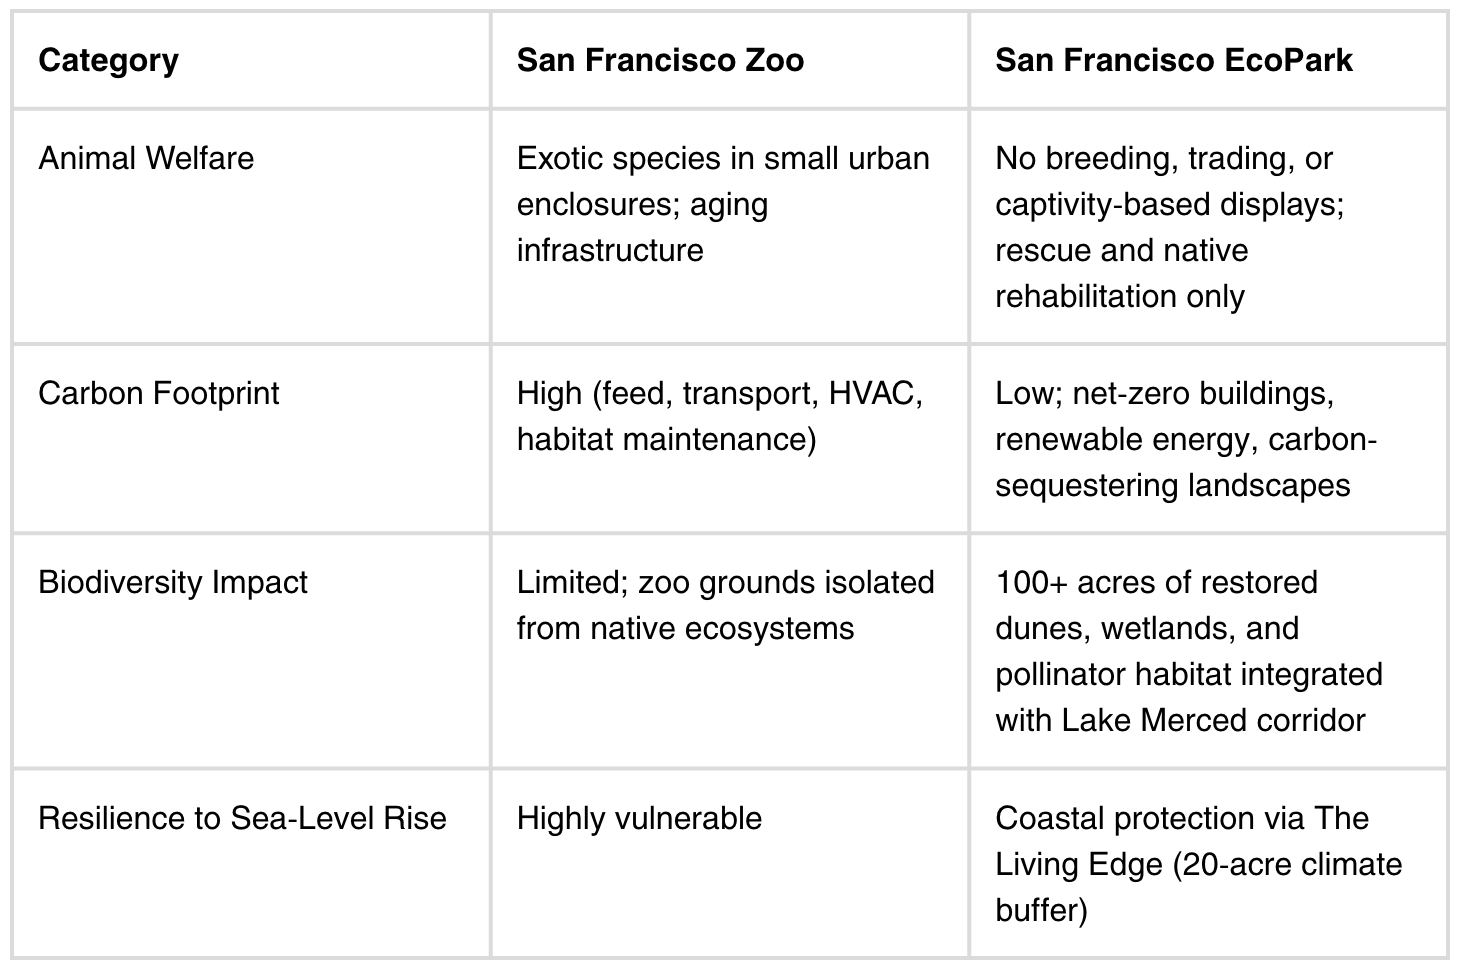
Ethical & Environmental Comparison
Bottom Line
How We Developed the EcoPark SF Estimates
EcoPark SF’s cost and revenue estimates were developed using publicly available data, built civic projects, and San Francisco–specific benchmarks. Rather than relying on speculative assumptions, the estimates reference projects the City of San Francisco has already built and evaluated, alongside documented examples of zoo-to-ecopark transformations.¹²³⁴⁵⁶
Where the Numbers Come From
EcoPark SF’s estimates draw from the following verifiable sources:
Presidio Tunnel Tops and Crissy Field — benchmarks for large-scale park construction, rewilding, and coastal infrastructure in San Francisco.¹²
California Academy of Sciences — comparator for education-focused facilities, exhibit operations, attendance scale, and earned-revenue models.³
Buenos Aires EcoParque — documented example of a major city converting a traditional zoo into a public EcoPark centered on conservation and education.⁴
San Francisco Controller’s Office and Office of Economic Analysis — sources for standard City methodology on cost benchmarking and economic impact analysis.⁵
San Francisco Public Works — source for local construction cost indices, labor assumptions, and infrastructure pricing.⁶
Estimated Costs
Transforming the approximately 100-acre San Francisco Zoo site into EcoPark SF is projected to cost $300–$400 million, including:
Demolition of obsolete structures and site remediation
Rewilding, dune systems, wetlands, and native habitat restoration
Construction of education, climate, and learning centers
Paths, utilities, renewable energy systems, and visitor infrastructure
These estimates reflect San Francisco–specific construction costs, inflation-adjusted comparisons to recent civic projects, and phased implementation assumptions consistent with how large public sites are redeveloped in the city.¹²⁵⁶
Sources & Footnotes
Presidio Trust — Presidio Tunnel Tops
https://presidio.gov/explore/attractions/presidio-tunnel-tops
Golden Gate National Parks Conservancy — Crissy Field
https://www.parksconservancy.org/parks/crissy-fieldCalifornia Academy of Sciences — Impact & Public Value
https://www.calacademy.org/impactGovernment of the City of Buenos Aires — EcoParque Buenos Aires
https://www.buenosaires.gob.ar/ecoparqueCity & County of San Francisco — Office of Economic Analysis
https://www.sf.gov/information--office-economic-analysisSan Francisco Public Works — Infrastructure & Construction Resources
https://www.sfpublicworks.org/infrastructure
https://www.sfpublicworks.org/services/contracting-opportunities-and-resources